
When operating a high temperature test chamber, the data logs it generates are more than just numbers on a screen—they are the critical evidence of product reliability and test validity. Yet many engineers find themselves staring at spreadsheets of temperature readings, ramp rates, and dwell times without a clear method to extract actionable insights. This article provides a structured approach to interpreting those data logs, highlighting the key parameters you must verify, common pitfalls to avoid, and how leveraging the precision of HEATEST Instrument equipment can simplify the entire process.
A high temperature test chamber's data log is the sole objective record of what actually happened inside the chamber during a test. Manufacturers, quality assurance teams, and R&D laboratories rely on these logs to certify that products meet specifications such as MIL-STD, IEC, or customer-specific thermal profiles. Misinterpreting a single temperature spike or a minor deviation in dwell time can lead to false pass/fail decisions, costly retesting, or worse—field failures. Understanding how to correctly read HEATEST Instrument's data logs ensures your test results are defensible and repeatable.
Most modern high temperature test chamber data logs include the following core metrics:
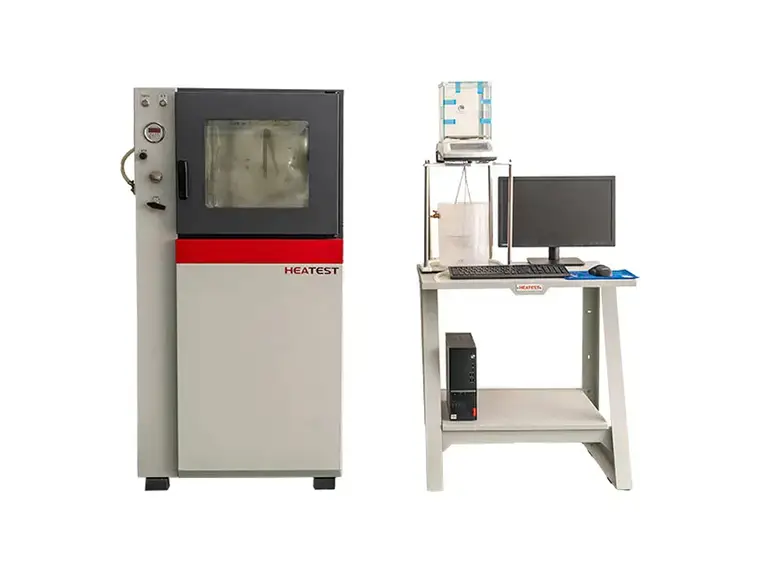
Start by overlaying the setpoint profile with the actual measured temperature curve. For a valid test, the actual temperature should stay within the specified tolerance band (e.g., ±2°C) for the entire duration. Use the log's graphical view if available, or plot the difference. With HEATEST Instrument's integrated software, this overlay is generated automatically, saving hours of manual comparison.
...
For more detailed information on how to interpret data logs from high-temperature test chambers, please click here: https://www.lyheatest.com/tester-knowledge/interpret-data-logs/